Elevation profiles, redesigned waypoint sidebar, and more ways to export
Plot Along 2.2.0 brings elevation data to every route. See the climbs and descents ahead of you, explore detailed stats for each waypoint, and export richer files to your favorite navigation apps.
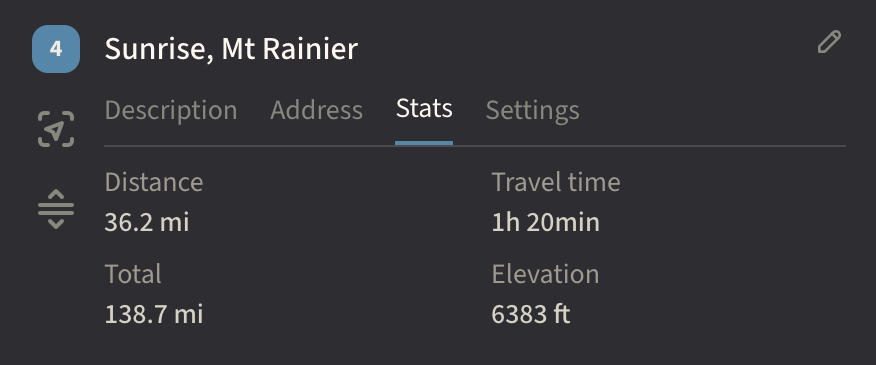
Waypoint Stats
Each waypoint now shows distance, travel time, and elevation alongside the rest of its details.
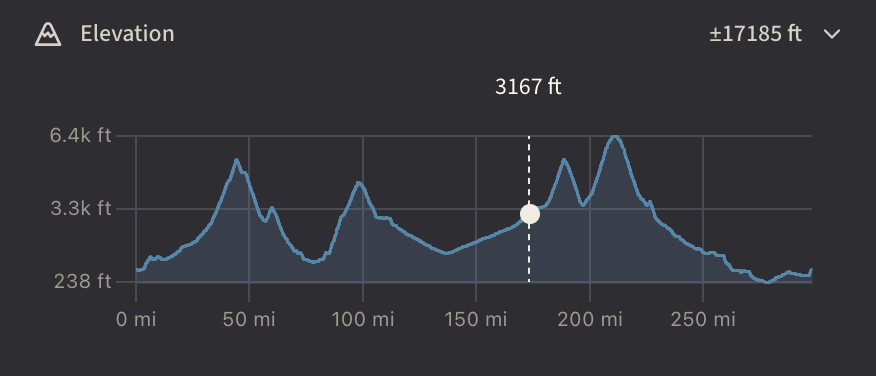
Interactive Elevation Chart
A collapsible chart in the sidebar traces the full profile of your route. Hover to see the exact elevation at any point, with a dot on the map showing you where that point is.
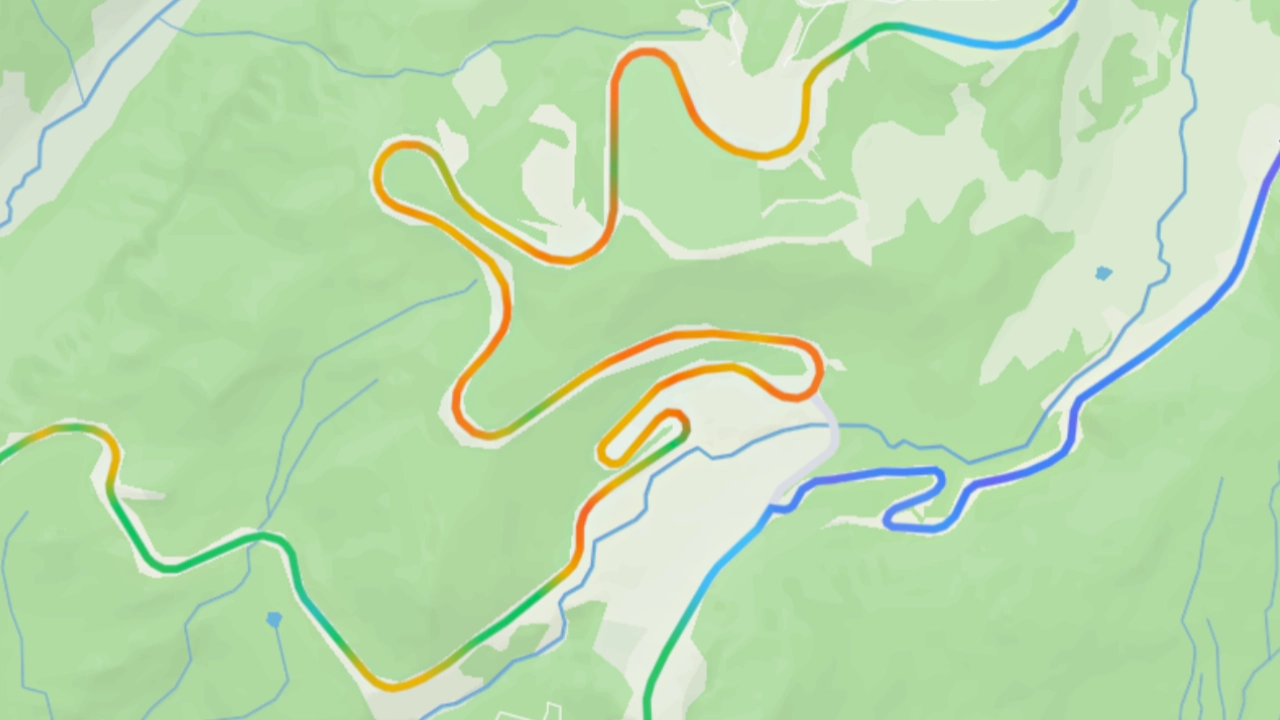
Grade Overlay
A toggle button colors your route line by grade so you can spot the steep sections at a glance. Steeper grades progress from green to red when ascending, or from light blue to purple when descending.
Redesigned Waypoint Sidebar
The waypoint sidebar has been reorganized to put everything one tap away.
- Wider sidebar. The sidebar is roomier on tablets and desktops for easier reading and editing.
- Tabbed interface. Description, Address, Stats, and Settings each get their own tab, replacing the old overlay menus and modal dialogs.
- Inline editing. Edit names and descriptions right where you see them, with no separate modal.
- Smarter loop waypoints. The return-to-start waypoint now has full tabs with stats, address lookup, and a one-click option to disable the loop.
Export
Getting your route data into other apps is faster and more flexible.
- Per-waypoint export. Open any single waypoint in Google Maps, Apple Maps, or Waze.
- Dashboard export. The “Open with…” option in map card menus lets you export without opening the editor first.
Reliability & Polish
- Faster waypoint insertion. Adding a waypoint to the start or middle of a route is faster than ever.
- Undo and redo. Waypoint undo/redo now restores the correct order every time.